EPIC Vegetation Product
The DSCOVR EPIC Vegetation Earth System Data Record (VESDR) provides Leaf Area Index (LAI) and diurnal courses of Normalized Difference Vegetation Index (NDVI), Sunlit Leaf Area Index (SLAI), Fraction of incident Photosynthetically Active Radiation (FPAR) absorbed by the vegetation and Directional Area Scattering Function (DASF). The product at 10 km sinusoidal grid and 65 to 110 minute temporal frequency is generated from the upstream DSCOVR EPIC L2 MAIAC surface reflectance product. Whereas LAI is a standard product of many satellite missions, global diurnal courses of NDVI, FPAR, SLAI and DASF are new satellite derived products (Fig. A1). Sunlit and shaded leaves exhibit different radiative response to incident Photosynthetically Active Radiation (400-700 nm), which in turn triggers various physiological and physical processes required for the functioning of plants. Leaf area and its sunlit portion are key state parameters in most ecosystem productivity models and carbon/nitrogen cycle. DASF provides information critical to accounting for structural contributions to measurements of leaf biochemistry from remote sensing.
Theoretical basis of the operational algorithm is documented in Yang et al. (2017) and summarized as follows. The Look-up-Table (LUT) approach implemented in the MODIS operational LAI/FPAR algorithm is adopted. The LUT has been significantly modified. First, its parameterization incorporates the canopy hot spot phenomenon (Fig. A2) and recent advances in the theory of canopy spectral invariants. This allows more accurate decoupling of the structural and radiometric components of the measured Bidirectional Reflectance Factor (BRF), improves scaling properties of the LUT and consequently simplifies adjustments of the algorithm for data spatial resolution and spectral band compositions. Second, the stochastic radiative transfer equations are used to generate the LUT for all biome types. The equations naturally account for radiative effects of the three-dimensional canopy structure on the BRF and allow for an accurate discrimination between sunlit and shaded leaf areas. Third, the LUT entries are measurable, i.e., they can be independently derived from both below canopy measurements of the transmitted and above canopy measurements of reflected radiation fields. This feature makes possible direct validation of the LUT, facilitates identification of its deficiencies and development of refinements.
The BRF of the vegetation reaches its maximum in the backscattering directions (Fig. A2). This is the so-called hot spot effect: i.e. a sharp increase in canopy reflected radiation when scattering direction approaches the direction to the sun. The EPIC sensor therefore sees the brightest portion of the canopy reflected radiation. This feature allows us not only to directly obtain sunlit leaf area but also estimate how individual leaves reflect solar radiation, which is unique diagnostic information about leaf biochemical constituents. Leaf optical properties can be described by the scattering coefficient, which is the fraction of the canopy intercepted radiation that has been reflected from, or diffusely transmitted through, the canopy. This variable can be estimated as the ratio between spectrally varying BRF and spectrally invariant DASF. Figure A3 shows a false color image (688-551-680) of the scattering coefficient derived from DSCOVR EPIC images. The radiation scattered by the vegetation in backscattering directions is very strong, allowing the EPIC to see green leaves even through optically thin-clouds.
The EPIC level 2 VESDR product and accompanying documentation are available from the NASA Langley Atmospheric Science Data Center.
Ref.
Yang, B., Knyazikhin, Y., Mõttus, M., Rautiainen, M., Stenberg, P., Yan, L., Chen, C., Yan, K., Choi, S., Park, T., & Myneni, R.B. (2017). Estimation of leaf area index and its sunlit portion from DSCOVR EPIC data: Theoretical basis. Remote Sensing Environment, 198, 69-84, doi:10.1016/j.rse.2017.05.033.
Marshak, A. and Y. Knyazikhin, 2017: The spectral invariant approximation within canopy radiative transfer to support the use of the EPIC/DSCOVR oxygen B-band for monitoring vegetation. J. Quant. Spectrosc. Radiat. Trans., 191, 7-12, doi:10.1016/j.jqsrt.2017.01.015.
NDVI
FPAR
August 23, 2016
SLAI
DASF
Figure A1. Diurnal course of global NDVI, FPAR, SLAI and DASF and corresponding EPIC image for August 23, 2016.
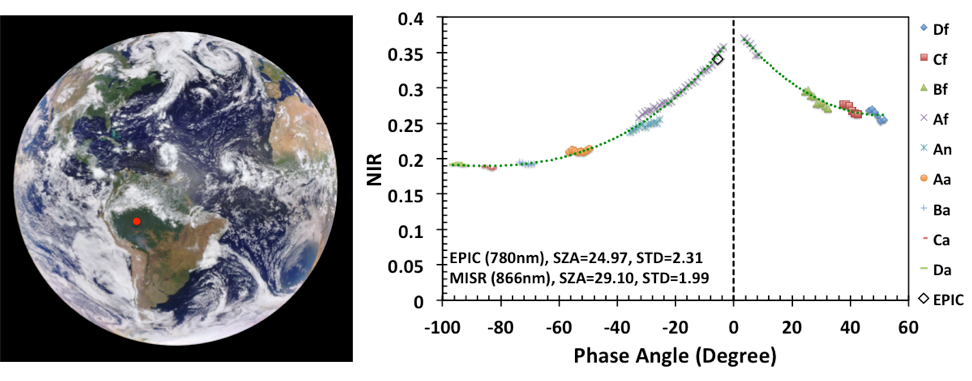
Figure A2. Left panel: enhanced RGB image of the sunlit face of the Earth (http://epic.gsfc.nasa.gov/enhanced) taken on Aug-23-2016 at 15:24:58 UTC. Left panel: NIR BRF of an area in Amazonian rain forest shown as red circle derived from MISR data (symbols) and EPIC (white square). Horizontal axis shows values of the phase angle, i.e., the angle between directions to the Sun and sensor.
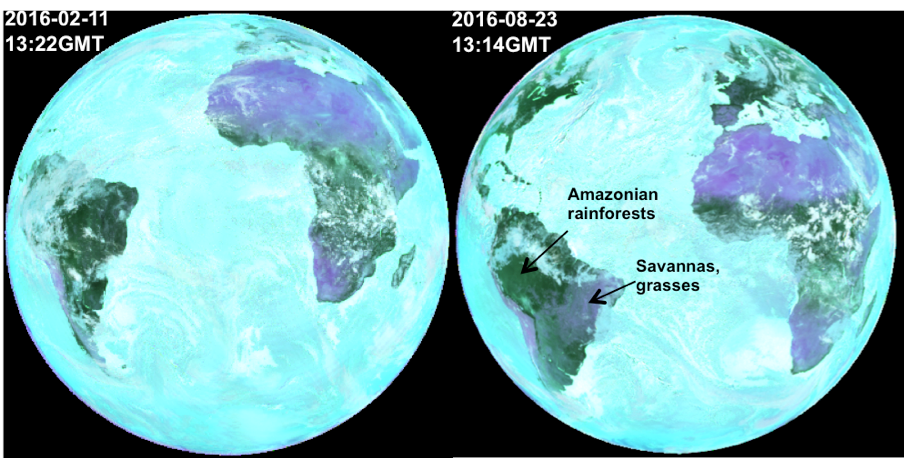
Figure A3. Vegetation dynamics. False color image (688-551-680) of the scattering coefficient derived from DSCOVR EPIC images taken on Feb-11-2016 at 13:22 UTC and Aug-23-2016 at 13:14 UTC using a simple algorithm documented in (Marshak&Knyazikhin, 2017). The green color indicates green leaves that EPIC sees through the atmosphere. The images capture changes in savannas from wet (approximately June to September) and dry (October to May) seasons when area of green leaves increases during the wet season and decreases during the dry season.