Gallery: Moon observations by the EPIC spectrometer
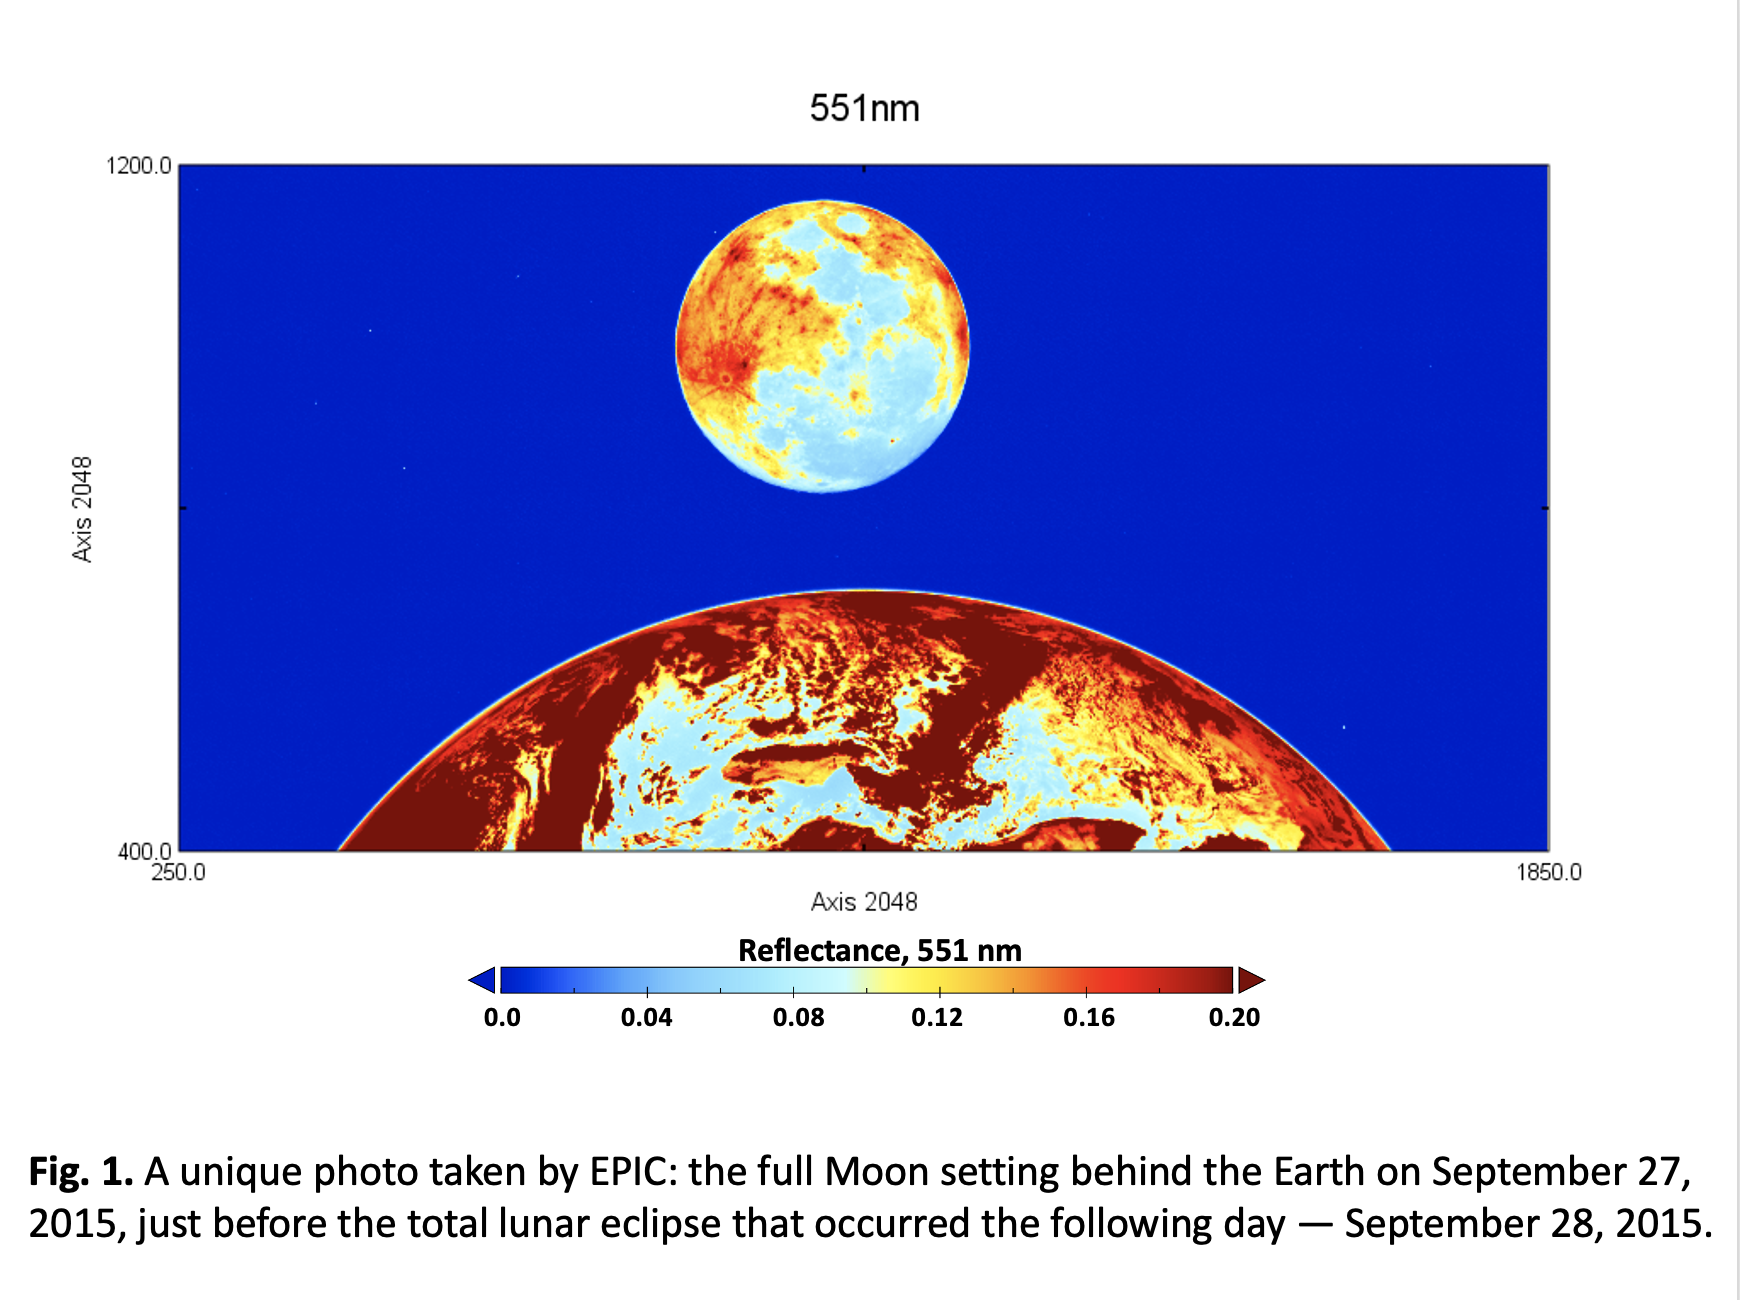
DSCOVR/EPIC captures images of the near (Fig. 1) and far sides of the Moon in the multiple UV-VIS-NIR wavelengths. Images of the Moon taken by EPIC can be treated as scientific data with a unique set of characteristics:
- They were acquired under full-disk illumination of the Moon.
- They were taken at 10 wavelengths — from UV (317 nm) to NIR (780 nm).
- At each wavelength the entire lunar disk is imaged simultaneously.
- The images can be oversampled to reduce noise levels and increase spatial resolution.
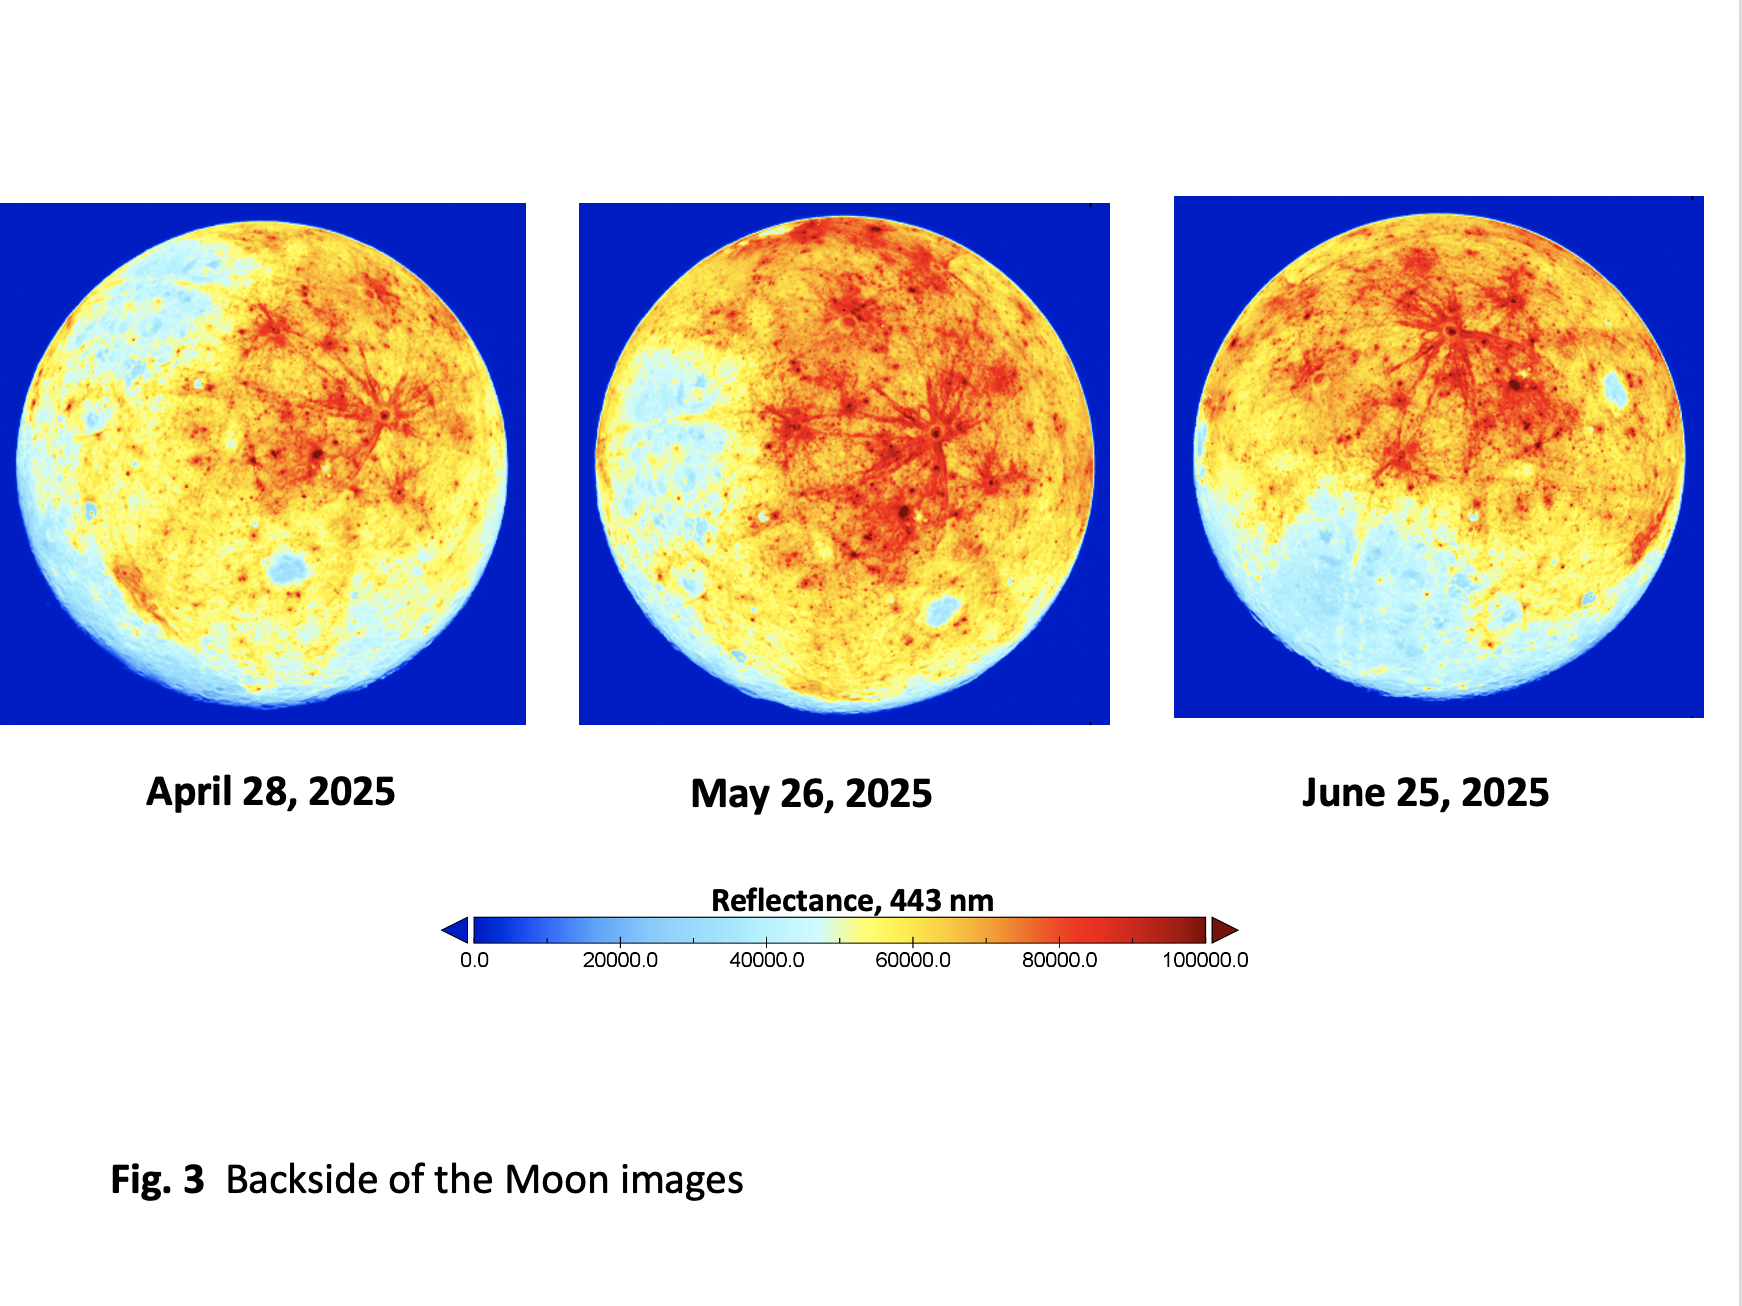
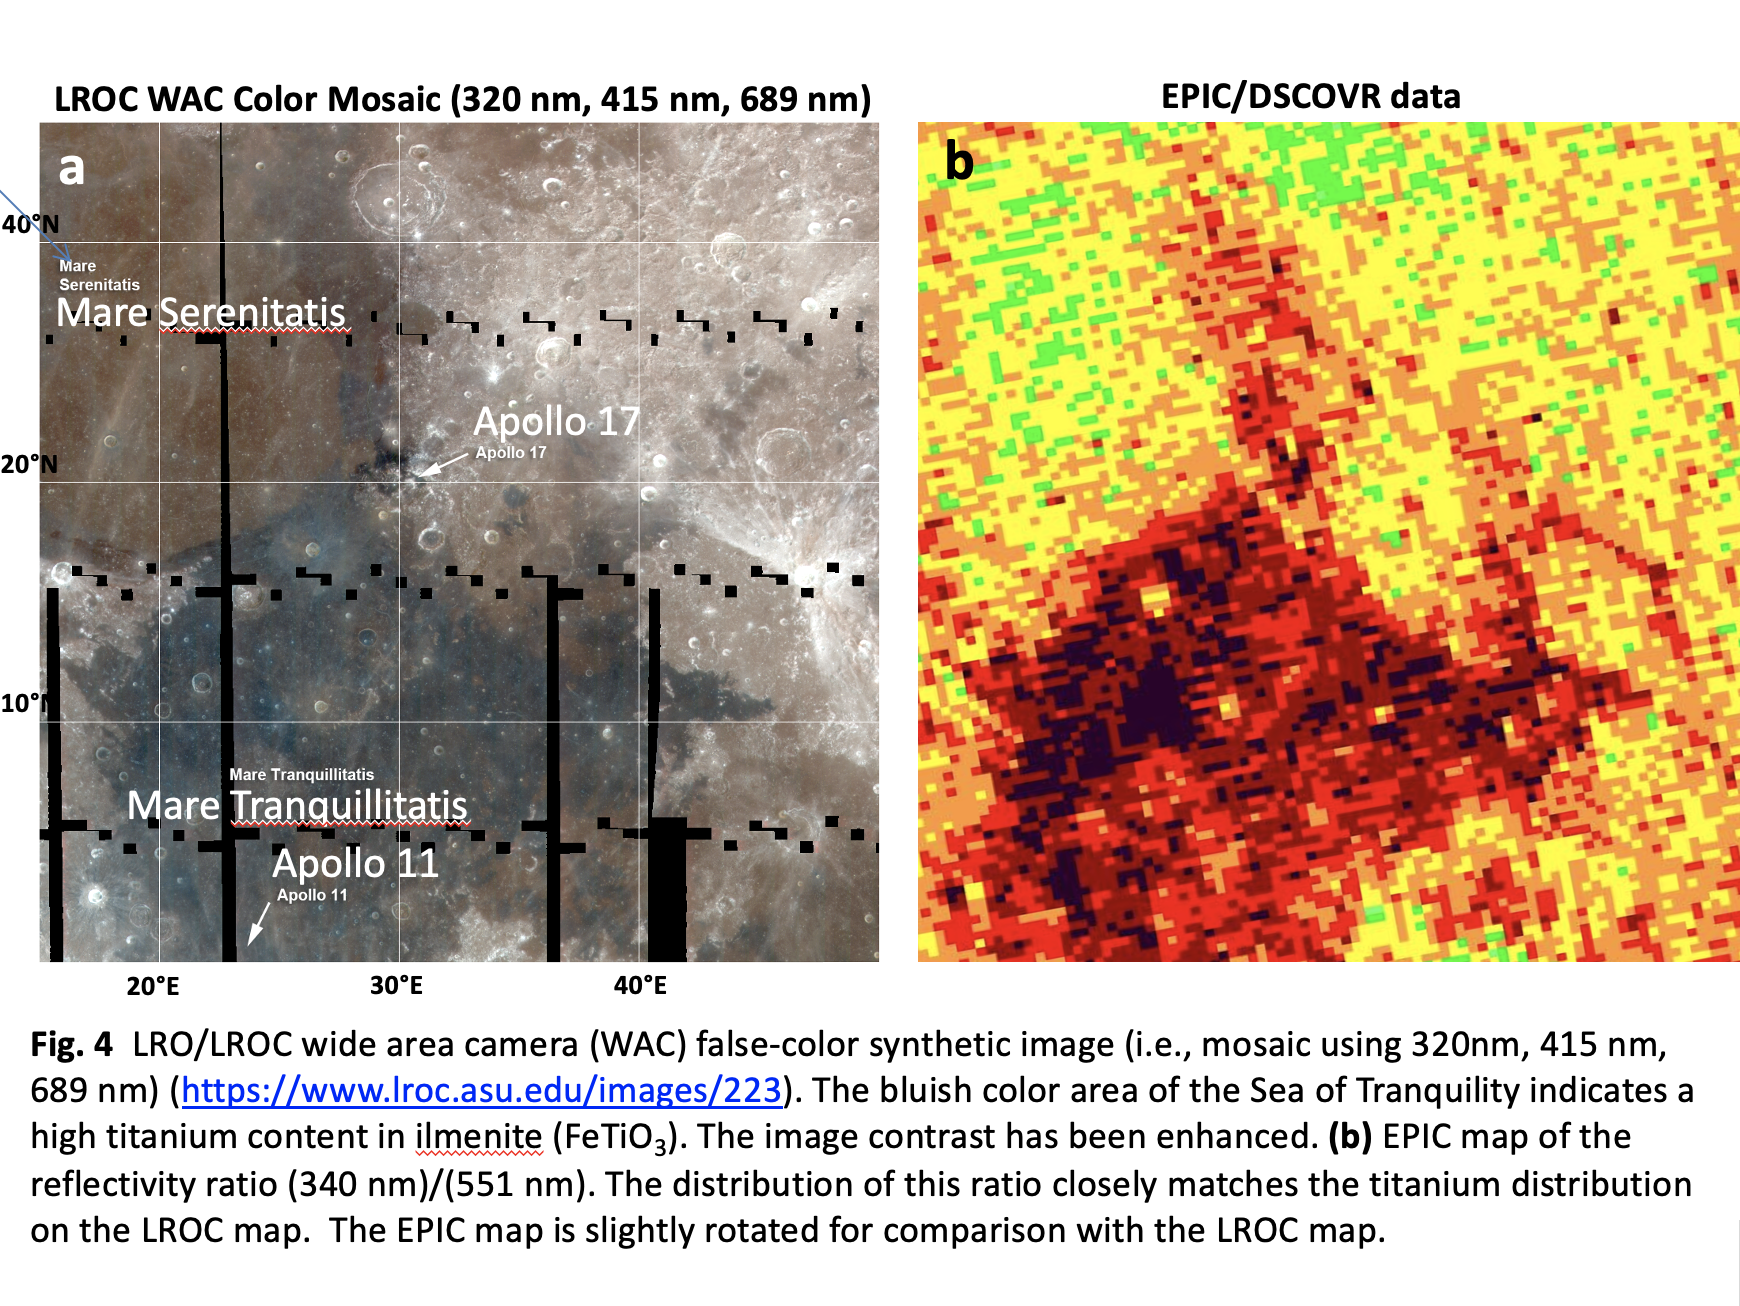
These features of the lunar images allow the creation of high-quality maps of the far and near sides of the Moon in 10 quasi-monochromatic wavelengths. The maps will serve as a reference point for comparison with data from other satellites in lunar orbit. Multispectral images of the Moon reveal a significant mineralogical difference between the nearside (Fig. 2) and the farside (Fig. 3) of the Moon and an increased concentration of ilmenite (a titanium-iron oxide mineral, FeTiO3) on the nearside of the Moon, particularly in the Sea of Tranquility (Fig. 4).
Figure 1. A unique photo taken by EPIC: the full Moon setting behind the Earth on September 27, 2015, just before the total lunar eclipse that occurred the following day — September 28, 2015.
Figure 2. Backside of the Moon.
Figure 3. LRO/LROC wide area camera (WAC) false-color synthetic image (i.e., mosaic using 320nm, 415 nm, 689 nm) (https://www.lroc.asu.edu/images/223). The bluish color area of the Sea of Tranquility indicates a high titanium content in ilmenite (FeTiO3). The image contrast has been enhanced. (b) EPIC map of the reflectivity ratio (340 nm)/(551 nm). The distribution of this ratio closely matches the titanium distribution on the LROC map. The EPIC map is slightly rotated for comparison with the LROC map.